Apigee–Throughput, Response Time and Error Rate

on Monday, December 31, 2018

I was listening to Lynda.com’s training course DevOps Foundations: Monitoring and Observability with Ernest Mueller and Peco Karayanev. I thought I heard Mr. Mueller say that Google had a a trinity of metrics which they always cover when developing Web APIs: Throughput, Response Time, and Error Rate. He stressed that it’s important to look at all of these indicators on the same dashboard, because they create a more informed view when displayed together. I did a quick search and it didn’t really pop-up on a google site, but what Mueller said was pretty much described on New Relic’s Application Monitoring page.

One thing that made a lot of sense to me was how these three metrics are strong indicators of when a major outage is going to happen. If the response times go up but everything else is the same, then a downstream system (like a database) is probably having an issue. If the throughput drops but the response times don’t then a system earlier in the workflow is probably having an issue. And, a ton of errors is a ton of errors in the web api.

So, I wanted to know how difficult it would be to create a report in Apigee which could visualize all three of these metrics on the same screen.

To do this, I created a Custom Report in the Analyze section of the Edge Admin portal and setup these metrics:

  • Average Transactions per Second

    This should be your throughput. One thing that Mueller and Karayanev said was that you shouldn’t look at averaged metrics in isolation. If you monitor an average for a particular metric, you should also have a Max or Min of the same metric. That way you don’t see misleading information where the average number of transactions look normal, but that is actually hiding spikes in traffic. Unfortunately, there was no pre-built metric for Sum of Transactions per Second.
  • Total Response Time (Average) and Total Response Time (Max)

    Following the guidance from above (don’t look at average metrics in isolation), both of these metrics combine to show a solid view of the real response times.
  • Target Errors (Sum)

    The system also has Proxy Errors and Policy Errors. I chose to go with Target Errors, because they are the errors that should indicate if the actual Web API was having problems.
  • Filter

    I also used a filter at the end to remove two things that could corrupt the data:

    1) The dining-cams proxy is a streaming proxy and never closes it’s connection. So, the average response time is always the maximum value the graph will hold.

    2) In an early post I talked about using a /upcheck endpoint to ensure proxies were up and running. I needed to remove those requests so the data wouldn’t be skewed by synthetic calls.

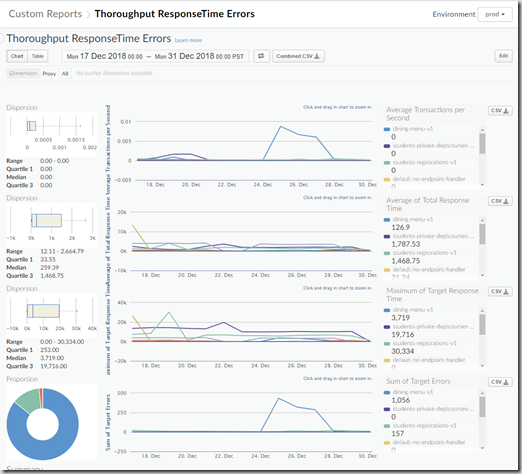
Overall, it looked like this:

image

We have very few users of the system, so there wasn’t much data to actually show. But, it did provide a few pieces of good information:

  • The Registrations endpoint is pretty sluggish.
    • The private endpoints are expected to take a long time (those response times are actually kind of fast)
  • The Dining Menu endpoint could have it’s error logs looked over.

image

image

.dental domain registry

on Monday, December 24, 2018

A local dentist office has a website at http://lompoc.dental. The simplicity of the name captured my attention. When did .dental become a domain name? Why didn’t they put www in front of it? So simple, so clean.

So, when did .dental become a domain name?

Back in 2014 ICANN opened up a whole slew of new domain name possibilities with a New gTLD Program. And, a company called Donuts gathered a vast amount of funding in order to purchase 307 domain names (.free, .inc, .poker, etc). One of those domains was .dental. It seems like the goal of donuts was to beat the land rush for customized domain names (like lompoc.dental) and be able to recuperate all the money they spent ($56 million?) when registering new domains.

This is probably a pretty solid plan if they are charging a reasonable amount for registering domains with them. I headed over to godaddy.com to checkout what the price would be for someplacenew.dental. Which turned out to be about $70. I figure godaddy is making a little money off the transaction, but probably not much. So let’s say Donuts is making $65 per domain name registry, how many registry’s would they need per year to make back ~$60 million? About 92,300 names per year.

That seems like a lot. I hope they purchased some really good names.

Copying Build Task Groups with VSTeam

on Monday, December 17, 2018

So, we finally got around to updating our VSTS / Azure DevOps XAML based builds to Pipeline builds (the slick web based builds). This effort is just in time to get the functionality switched over before XAML builds get disabled on Azure DevOps. From Brian Harry’s Blog:

By the end of 2018, we will remove all support for XAML builds in all Team Services accounts.  By that time, all customers will need to have migrated to the newer build system version because their XAML builds can no longer be run.  We will continue to support the web based experience for viewing previously completed XAML based builds so that you have access to all your historical data.

The process of converting over these builds has been tremendously helped by the excellent open source VSTeam Powershell module (github). The creator of this module, DarqueWarrior (Donovan Brown), is amazingly talented and particular in his development practices. And, I love him for it.

Using his/his teams module as the underlying framework it was pretty quick and easy to build out a little additional functionality to copy Task Groups from one project to another. I would love to contribute the addition back to the project, but I just don’t have the time to put together the meticulous unit tests, follow the excellent coding standards, and integrate it into the underlying provider. I’m still in a race to get these builds converted before they get turned off.

So, here’s a quick gist of building some copying functionality on top of VSTeam:

How much overhead does Apigee add to a request?

on Monday, December 10, 2018

So, I got asked this question earlier today and was surprised that I never memorized an answer.

It’s definitely dependent on your configuration, but for our purposes it looks like it’s about 60 ms. And, it’s probably less than that (see below).

image

The total time states 267ms, but the response actually sends back to the client around the 220ms mark. Of those 220ms, about 162ms is spent making the round trip to the application server to process the request. Below is a more detailed break down. But, you should be aware that many of the 1ms values listed below are actually < 1ms. The total values are probably lower than the values quoted.

image

MyGetUcsb–Unlisting and Soft Deletes

on Monday, December 3, 2018

In a previous post about moving packages between feeds in MyGet I introduced a Remove-MyGetPackage command. The command’s default functionality was to perform a “hard delete”. Which would completely remove the package from the registry rather than unlisting it. This made sense in the context of a Move-MyGetPackage command. Because you want to move the package from one to feed to another.

But, it introduced some other problems when actually using it to Delete packages.

Sometimes, the day after you publish a package you find a bug, do a quick fix and publish a new version of the package. In those scenarios, I thought it was okay to delete the old package because anyone that had downloaded the old version would just update to the new version when they found it was no longer available in the feed. This turned out to be way more difficult than I thought.

Here’s what I didn’t understand:

The way nuget updates are designed, they need to have the original package available to them before doing an update.

So, if you download someone else’s source code and you try to build it, you can run into a “Package Not Found” error during the process. This might happen because I deleted that version of the package. My assumption would be that the person who downloaded the code would check MyGet and see that a newer version of the package is available and Update-Package to the new version. However, this is where the problem lies.

Update-Package requires that the previous version of the package to be available before it will perform the update. And since the package doesn’t exist anymore, it can’t do that.

And this is by design. As such, the nuget API makes the delete operation a soft delete (unlist). And, I was overriding the original designers intentions by defaulting to a hard delete. So, I did two things to get back inline with the original designers game plan:

  • Added an –Unlist parameter to Remove-MyGetPackage
  • Added a wrapper function called Hide-MyGetPackage (that’s the best verb I could find for “Unlist”).

VSTS moves to Azure DevOps

on Monday, November 26, 2018

A few weeks ago Microsoft announced rebranding Visual Studio Team Services (VSTS) as Azure Dev Ops. One of the things that will be coming down the pike is a rebranding of the dns host name for VSTS.

Org URL setting

The change will take an organization url from https://{org}.visualstudio.com/ to https://dev.azure.com/{org}.

It’s not a big switch, but one that you need to plan for. We’re looking to do these things:

  • Update Firewall Rules
  • Update Build Agents
  • Update Your Visual Studio Source Control Settings
    • This is really simple and straight forward
  • Update Your Team Projects to use the new source control address (TFSVC)
    • We’re not yet on git, so this is one for the slow pokes

Here is a script to help find all your .sln files and update them to the new address.

Adding a /deploycheck to all Apigee API Proxies

on Monday, November 19, 2018

Apigee has a way to perform healthchecks against Target Servers in order to ensure that requests are routed to a healthy application service. But, what about this rare scenario: An API Proxy is being replaced/updated and the new API Proxy never gets deployed to ‘prod’. And, the prod endpoint no longer has an API Proxy handling requests for it.

In the scenario where the API Proxy is accidently not deployed to ‘prod’, the only way to test for the mistake is using an outside tester. And, there are a lot of services out there that can provide a ping or healthcheck to do that:

In all of those scenarios, you will need the API Proxy to respond back that it’s up and running. In this particular scenrio (“The the API Proxy running in prod?”), we don’t need a full healthcheck. All we need is a ping response. So …

Here’s a quick way to add an /upcheck (ping response) endpoint on to every API Proxy using the Pre-Proxy Flow Hook. To do this …

  • Create an /upcheck response shared flow (standard-upcheck-response)
  • Create a standard Pre-Proxy shared flow which you can add and remove other shared flow from.
  • Setup the standard Pre-Proxy shared flow as the Pre-Proxy Flow Hook.

Create the standard-upcheck-response shared flow

Create the standard-preproxy shared flow to plan for future additions to the flow hok

And finally setup the flow hook

image

Apigee CORS Headers During Api Key Failure

on Monday, November 12, 2018

In a previous post, I mentioned sending OPTIONS responses so Swagger UIs can call a webservice without getting an error.

Unfortunately, there’s a second scenario where Swagger UI can conceal an error from being displayed because the error flow doesn’t include CORS headers.

The Problem Scenario

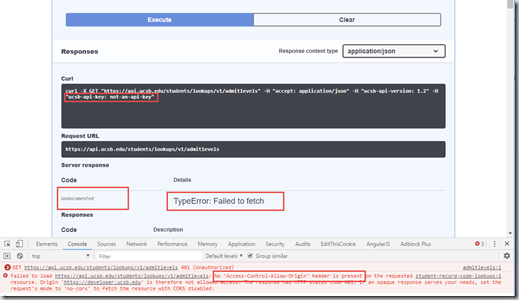
If your API Key doesn’t validate, then an error will be generated by the VerifyApiKey Policy and will return an error message to the Swagger UI browser without any CORS headers attached. This is what it looks like …

You’re in the browser and you ask for the Swagger UI to send a request with a bad API Key and you get back a “TypeError: Failed to fetch” message. And, when you look at the console you see No ‘Access-Control-Allow-Origin’ header is present.

image

When you switch over to the network view, you can see that the initial OPTIONS response came back successfully. But, you actually got a 401 Unauthorized response on your second request.

image

If you look further into the second request, you will find the error response’s headers don’t contain the Access-Control-Allow-Origin header.

image

If you then pull up the Trace tool in Apigee, you can see that the Verify API Key policy threw the error and the request returned before having any CORS headers applied to it.

image

How to Fix This

So, what we need to do is add CORS headers onto the response before it’s sent back. And, to do that we can use the Post-proxy Flow Hook. These are generally reserved to do logging tasks, but we are going to use them to add headers.

image

This Post flow will now add all of the headers on every response. So, the Apigee Trace tools output now looks like this:

image

Which will now send the CORS response headers to the browser:

image

And that will result in the real error message appearing in the Swagger UI Tester:

image

The Shared Flow used in the pictures above is some over done. Here is a much simpler Flow Task modeled after the previous post on the topic. This would be quick and easy to setup:

MyGetUcsb – Move a package between feeds

on Monday, November 5, 2018

MyGet is pretty dang cool, but the delete functionality was a little surprising. Specifically, this is the delete functionality through the nuget API. The delete functionality through the websites UI is fantastic and really easy to follow.

The NuGet team put together great documentation why a delete operation is considered to be an “unlist” operation. They even have policy statements about it. The weird part is that even though the standard DELETE operation should unlist the package in MyGet, my experimentation didn’t show that happening. Instead the package kept being listed.

But, I have diligent co-workers that were able to not only make the package unlist, but they found out how to do a hard delete. I’m not sure how they found out about ‘hardDelete=true’, but if they found it by reading deeply into the sample code provided by MyGet then I am truly impressed.

The code sample demonstrates functionality that is also available as method Move-MyGetPackage in the MyGetUcsb powershell module.

AWS ALB Price Planning w/ IIS : Add IisLogWebAppId

on Monday, October 29, 2018

This post continues the series from AWS ALB Price Planning w/ IIS : Grouped Sites.

This doesn’t really help figure out much in the larger picture. But, I wanted to separate out statistics about the Web API applications from the normal web applications. Web API applications are strong candidates for rewrites as Serverless ASP.NET Core 2.0 Applications on Lambda Functions. Changing these applications to Lambda Functions won’t reduce the cost of the ALB as they will still use host names that will be serviced by the ALB. But, this will help figure out the tiny tiny costs that the Lambda Functions will charge each month.

This is just an intermediary step to add WebAppId’s to all of the requests.

Background Info

Instead of adding a WebAppId column onto the IisLog, I’m going to create a new table which will link the IisLog table entries to the ProxyWebApp table entries. The reason for this is that the IisLog table has 181,507,680 records and takes up 400 GB of space on disk. Adding a new column, even a single integer column, could be a very dangerous operation because I don’t know how much data the system might want to rearrange on disk.

Plan of Action and Execution

Instead, I’m going to

  1. Add a WebAppId int Identity column onto table dbo.ProxyWebApp. The identity column won’t be part of the Primary Key, but it’s also a super tiny table.
  2. Create a new table called dbo.IisLogWebAppId which takes the Primary Key of table dbo.IisLogWebAppId and combines it with WebAppId.
  3. Create a script to populate dbo.IisLogWebAppId.
  4. Create a stored procedure to add new entries nightly.

The scripts are below, but I think it’s worthwhile to note that the script to populate dbo.IisLogWebAppId took 4h57m to create on 181,507,680 records which was 15 GBs of disk space.

AWS ALB Price Planning w/ IIS : Grouped Sites

on Monday, October 22, 2018

This post continues the series from AWS ALB Price Planning w/ IIS : Rule Evaluations Pt. 2.

Having all the data in IIS and generating out all the hourly LCU totals helps define what the monthly charges could be. But, my expectations are that I will need to split the 71 DNS host names over multiple ALBs in order to reduce the total cost of the LCUs. My biggest fear is the Rule Evaluation Dimension. The more the host names on a single ALB, the more likely a request will go past the free 10 rule evaluations.

To do this, I need to build a script/program that will generate out possible DNS host name groupings and then evaluate the LCUs based upon those groupings.

In the last post I had already written a simple script to group sites based upon the number sub-applications (ie. rules) they contain. That script didn’t take the next step, which is to evaluate the combined LCU aggregates and recalculates the fourth dimension (the Rule Evaluation LCU).

But, before that …

The Full Database Model

So, instead of having to comb through the previous posts and cobble together the database. I think the database schema is generic enough that it’s fine to share all of it. So …

New Additions:

  • ALBGrouping

    This is the grouping table that the script/program will populate.
  • vw_ALB*

    These use the ALBGrouping table recalculate the LCUs.
  • usp_Aggregate_ALBLCUComparison_For_DateRange

    This combines all the aggregates (similar to vw_ProxySiteLCUComparison). But, the way the aggregation works, you can’t filter the result by Date. So, I needed a way to pass a start and end date to filter the results.

ALB Grouping Results

Wow! It’s actually cheaper to go with a single ALB rather than even two ALBs. It way cheaper than creating individual ALBs for sites with more than 10 sub-applications.

I wish I had more confidence in these numbers. But, there’s a really good chance I’m not calculating the original LCU statistics correctly. But, I think they should be in the ball park.

image

I have it display statistics on it’s internal trials before settling on a final value. And, from the internal trials, it looks like the least expensive options is actually using a single ALB ($45.71)!

Next Up, AWS ALB Price Planning w/ IIS : Add IisLogWebAppId.

AWS ALB Price Planning w/ IIS : Rule Evaluations Pt. 2

on Monday, October 15, 2018

This post continues the series from AWS ALB Price Planning w/ IIS : Rule Evaluations.

In the last post, I looked at the basics of pricing a single site on an ALB server. This time I’m going to dig in a little further into how to group multiple sites onto multiple ALB servers. This would be to allow a transition from a single IIS proxy server to multiple ALB instances.

Background

  • The IIS proxy server hosts 73 websites with 233 web applications.
  • Any site with 8 or more web applications within it will be given it’s own ALB server. The LCU cost of having over 10 rule evaluations on a single ALB are so dominant that it’s best to cut the number of rules you have to less than 10.
  • Of the 73 websites, only 6 sites have 8 or more web applications within them. Leaving 67 other websites containing 103 web applications.

Findings from last time

I looked at grouping by number or rules and by average request counts.

If you have figured out how to get all the import jobs, tables, and stored procedures setup from the last couple posts then you are amazing! I definitely left out a number of scripts for database objects and some of the scripts have morphed throughout the series. But, if you were able to get everything setup, here’s a nice little view t0 help look at the expenses of rule evaluation LCUs.

Just like in the last post, there is a section at the bottom to get a more accurate grouping.

Simple Grouping

To do the simple groupings, I’m first going to generate some site statistics, usp_Regenerate_ProxySiteRequestStats. They really aren’t useful, but they can give you something to work with.

You can combine those stats with the WebAppCounts and use them as input into a PowerShell function. This PowerShell function attempts to:

  • Separate Single Host ALBs from Shared Host ALBs
    • $singleSiteRuleLimit sets the minimum number of sub-applications a site can have before it is required to be on it’s on ALB
  • Group Host names into ALBs when possible
    • It creates a number of shared ALBs (“bags”) which it can place sites into.
    • It uses a bit of an elevator algorithm to try and evenly distribute the sites into ALBs.
  • Enforce Rule Limits
    • Unfortunately, elevator algorithms aren’t great at finding a good match every time. So, if adding a site to a bag would bring the total number of evaluation rules over $sharedSiteRuleLimit, then it tries to fit the site into the next bag (and so on).
  • Give Options for how the sites will be prioritized for sorting
    • Depending on how the sites are sorted before going into the elevator algorithm you can get different results. So, $sortByOptions lets you choose a few ways to sort them and to see the results of each options side by side.

The results look something like this:

image

So, sort by WebAppCount (ie. # of sub-applications) got it down to 19 ALBs. That’s 6 single ALBs and 13 shared ALBs.

Conclusion:

The cost of 19 ALBs without LCU charges is $307.80 per month ($0.0225 ALB per hour * 24 hours * 30 days * 19 ALBs). Our current IIS proxy server, which can run on a t2.2xlarge EC2 image, would cost $201.92 per month on a prepaid standard 1-year term.

The Sorting PowerShell Script

How to get more accurate groupings:

  • Instead of generating hourly request statistics based upon Date, Time, and SiteName; the hourly request statistics need to be based upon Date, Time, SiteName, and AppPath. To do this you would need to:
    • Assign a WebAppId to the dbo.ProxyWebApps table
    • Write a SQL query that would use the dbo.ProxyWebApps data to evaluate all requests in dbo.IisLogs an assign the WebAppId to every request
    • Regenerate all hourly statistics over ALL dimensions using Date, Time, SiteName and AppPath.
  • Determine a new algorithm for ALB groupings that would attempt to make the number of rules in each group 10. But, the algorithm should leave extra space for around 1000~1500 (1.0~1.5 LCU) worth of requests per ALB. The applications with the lowest number of requests should be added to the ALBs at this point.
    • You need to ensure that all applications with the same SiteName have to be grouped together.
    • The base price per hour for an ALB is around 2.8 LCU. So, if you can keep this dimension below 2.8 LCU, it’s cheaper to get charged for the rule evaluations than to create a new ALB.

Next Up, AWS ALB Price Planning W/ IIS : Grouped Sites.

    AWS ALB Price Planning w/ IIS : Rule Evaluations

    on Monday, October 8, 2018

    This post continues the series from AWS ALB Price Planning w/ IIS : Bandwidth. Here are couple things to note about the query to grab Rule Evaluations:

    • This can either be the most straightforward or most difficult dimension to calculate. For me, it was the most difficult.
    • The IIS logs I’m working have 73 distinct sites (sometimes referred to as DNS host names or IP addresses). But there are 233 web applications spread across those 73 distinct sites. An ALB is bound to an IP address, so all of the sub-applications under a single site will all become rules within that ALB. At least, this is the way I’m planning on setting things up. I want every application/rule under a site to be pointed at a separate target server list.
    • An important piece of background information is that the first 10 rule evaluations on a request are free. So, if you have less than 10 rules to evaluate on an ALB, you will never get charged for this dimension.
    • Another important piece of information: Rules are evaluated in order until a match is found. So, you can put heavily used sub-applications at the top of the rules list to ensure they don’t go over the 10 free rule evaluation per request limit.
      • However, you also need to be aware of evaluating rules in the order of “best match”. For example, you should place “/webservices/cars/windows” before “/webservices/cars”, because the opposite ordering would send all requests to /webservices/cars.
    • The point being, you can tweak the ordering of the rules to ensure the least used sub-application is the only one which goes over the 10 free rule evaluations limit.

    With all that background information, the number of rule evaluations are obviously going to be difficult to calculate. And, that’s why I fudged the numbers a lot. If you want some ideas on how to make more accurate predictions please see the notes at the bottom.

    Here were some assumptions I made up front:

    • If the site has over 8 sub-applications, that site should have it’s own ALB. It should not share that ALB with another site. (Because the first 10 rule evaluations are free.)
    • All sites with less than 8 sub-applications should be grouped onto shared ALBs.
    • For simplicity the groupings will be based on the number of rule evaluations. The number of requests for each sub-applications will not be used to influence the groupings.

    Findings

    Here were my biggest take aways from this:

    • When an ALB is configured with more than the 10 free rule evaluations allowed, the rule evaluation LCUs can become the most dominant trait. But, that only occurs if number of requests are very high and the ordering of the rules is very unfavorable.
    • The most influential metric on the LCU cost of a site is the number of requests it receives. You really need a high traffic site to push the LCU cost.
    • As described in the “How to get more accurate numbers” section below. The hourly base price of an ALB is $0.0225 per hour. The hourly LCU price is $0.008. So, as long as you don’t spend over 2.8 LCU per hour; it’s cheaper to bundle multiple sites onto a single ALB rather than make a new one.

    To demonstrate this, here was the second most heavily “requested” site. That site has 22 sub-applications. I used some gorilla math and came up with a statement of “on average there will be 6 rule evaluations per request” ((22 sub-applications / 2) – (10 free requests / 2)). Looking at August 1st 2018 by itself, the Rule Evaluations LCU was always lower the amount of Bandwidth used.

    image

    How to Gather the Data

    Since I wanted every application under a site to need a rule; I first needed to get the number of web applications on the IIS server. I do not have that script attached. You should be able to write something using the WebAdministration or IISAdministration powershell modules. I threw those values into a very simple table:

    Once you get your data into dbo.ProxyWebApps, you can populate dbo.ProxyWebAppCounts easily with:

    Now, we need to calculate the number of requests per application for each hour.

    And, finally, generate the LCUs for rule evaluations and compare it with the LCU values from the previous dimensions:

    How to get more accurate numbers:

    • Instead of generating hourly request statistics based upon Date, Time, and SiteName; the hourly request statistics need to be based upon Date, Time, SiteName, and AppPath. To do this you would need to:
      • Assign a WebAppId to the dbo.ProxyWebApps table
      • Write a SQL query that would use the dbo.ProxyWebApps data to evaluate all requests in dbo.IisLogs an assign the WebAppId to every request
      • Regenerate all hourly statistics over ALL dimensions using Date, Time, SiteName and AppPath.
    • Determine a new algorithm for ALB groupings that would attempt to make the number of rules in each group 10. But, the algorithm should leave extra space for around 1000~1500 (1.0~1.5 LCU) worth of requests per ALB. The applications with the lowest number of requests should be added to the ALBs at this point.
      • You need to ensure that all applications with the same SiteName have to be grouped together.
      • The base price per hour for an ALB is around 2.8 LCU. So, if you can keep this dimension below 2.8 LCU, it’s cheaper to get charged for the rule evaluations than to create a new ALB.

    Next Up, AWS ALB Price Planning w/ IIS : Rule Evaluations Pt. 2.

      AWS ALB Price Planning w/ IIS : Bandwidth

      on Monday, October 1, 2018

      This post continues the series about from AWS ALB Price Planning w/ IIS : Active Connections. Here are couple things to note about the query to grab Bandwidth:

      • This is one thing that IIS logs can accurately evaluate. You can get the number of bytes sent and received through an IIS/ARR proxy server by turning on the cs-bytes and sc-bytes W3C logging values. (see screen shot below)
      • AWS does that pricing based on average usage per hour. So, the sql will aggregate the data into hour increments in order to return results.

      image

      Bandwidth SQL Script

      Graphing the output from the script shows:

      • Mbps per Hour (for a month)
        • The jump in the average number of new connections in the beginning of the month corresponded to a return of students to campus. During the beginning of the month, school was not in session and then students returned.
        • The dip at the end of the month has to do with a mistake I made loading some data. There is one of data that I forgot to import the IIS logs, but I don’t really want to go back and correct the data. It will disappear from the database in about a month.
      • Mbps per Hour LCUs
        • This is a critical number. We put 215+ websites through the proxy server. The two AWS ALB dimensions that will have the biggest impact on the price (the number of LCUs) will be the Bandwidth usage and the Rule Evaluations.
        • I’m very surprised that the average LCUs per hour for a month is around 2.3 LCUs, which is very low.

      imageimage

      Next Up, AWS ALB Price Planning w/ IIS : Rule Evaluations.

      AWS ALB Price Planning w/ IIS : Active Connections

      on Monday, September 24, 2018

      This post continues the series about from AWS ALB Price Planning w/ IIS : New Connections. Here are a couple things to note about the query to grab Active Connections:

      • This query is largely based on the same query used in AWS ALB Price Planning w/ IIS : New Connections [link needed].
        • It’s slightly modified by getting the number of connections per minute rather than per second. But, all the same problems that were outlined in the last post are still true.
      • AWS does their pricing based on average usage per hour. So, the sql will aggregate the data into hour increments in order to return results.

      Active Connections SQL Script

        Graphing the output from the script shows:

        • # of Active Connections per Minute by Hour (for a month)
          • The jump in the average number of new connections in the beginning of the month corresponds to a return of students to campus. During the beginning of the month, school was not in session and then the students returned.
          • The dip at the end of the month has to do with a mistake I made loading some data. There is one day of IIS logs that I forgot to import, but I don’t really want to go back and correct the data. It will disappear from the database in about a month.
        • # of Active Connections per Second by Hour Frequency
          • This doesn’t help visualize it as well as I would have hoped. But, it does demonstrate that usually the number of active connections per minutes will be less than 3000; so it will be less than 1 LCU (1 LCU = 3000 active connections per minute).

        imageimageimage

        Next Up, AWS ALB Price Planning w/ IIS : Bandwidth.

        AWS ALB Price Planning w/ IIS : New Connections

        on Monday, September 17, 2018

        AWS ALB Pricing is not straight forward but that’s because they are trying to save their customers money while appropriately covering their costs. The way they have broken up the calculation for pricing indicates that they understand there are multiple different reasons to use an ALB, and they’re only gonna charge you for the feature (ie. dimension) that’s most important for you. That feature comes with a resource cost and they to charge you appropriately for the resource that’s associated with that feature.

        Today, I’m going to (somewhat) figure out how to calculate one of those dimensions using IIS logs from an on-premises IIS/ARR proxy server. This will help me figure out what the projected costs will be to replace the on-premise proxy server with an AWS ALB. I will need to calculate out all the different dimensions, but today I’m just focusing on New Connections.

        I’m gonna use the database that was created in Putting IIS Logs into a Database will Eat Disk Space. The IisLog table has 9 indexes on it, so we can get some pretty quick results even when the where clauses are ill conceived. Here are a couple things to note about the query to grab New Connections:

        • As AWS notes, most connections have multiple requests flowing through them before they’re closed. And, IIS logs the requests, not the connections. So, you have to fudge the numbers a bit to get the number of new connections. I’m going to assume that each unique IP address per second is a “new connection”.
          • There are all sorts of things wrong with this assumption:
            • Browsers often use multiple connections to pull down webpage resources in parallel. Chrome uses up to 6 at once.
            • I have no idea how long browsers actually hold open connections.
            • Some of the sites use the websocket protocol (wss://) and others use long polling, so there are definitely connections being held open for a long time which aren’t being accounted for.
          • And I’m probably going to reuse this poorly defined “fudging” for the number of Active Connections per Minute (future post / [link needed]).
        • When our internal web app infrastructure reaches out for data using our internal web services, those connections are generally one request per connection. So, for all of the requests that are going to “services”, it will be assumed each request is a new connection.
        • AWS does their pricing based on average usage per hour. So, the sql will aggregate the data into hour increments in order to return results.
        • Sidenote: Because the AWS pricing is calculated per hour, I can’t roll these numbers up into a single “monthly” value. I will need to calculate out all the dimensions for each hour before having a price calculation for that hour. And, one hour is the largest unit of time that I can “average”. After that, I have to sum the results to find out a “monthly” cost.

        New Connections SQL Script

        Graphing the output from the script shows:

        • # of New Connections per Second by Hour (for a month)
          • The jump in the average number of new connections in the beginning of the month corresponds to a return of students to campus. During the beginning of the month, school was not in session and then the students returned.
          • The dip at the end of the month has to do with a mistake I made loading some data. There is one day of IIS logs that I forgot to import, but I don’t really want to go back and correct the data. It will disappear from the database in about a month.
        • # of New Connections per Second by Hour Frequency
          • This just helps to visualize where the systems averages are at. It helps show that most hours will be less than 30 connections per second; which is less than 2 LCU. (1 LCU = 25 new connections per second)

        imageimageimage

        Next Up, AWS ALB Price Planning w/ IIS : Active Connections.

        Apigee Catch All Proxy

        on Monday, September 10, 2018

        I’ve written before about how Apigee’s security is NOT Default Deny. In a similar thread of thought, I was recently speaking with an Apigee Architect who pointed out that it’s good idea to setup a Catch All Proxy in order to hide default error message information and help prevent search bots from indexing those error messages.

        It’s really quick to setup and and can actually help out your end users by having the catch-all proxy redirect them back to your Developer Portal.

        To do this:

        1. Create a new proxy, + Proxy.

        2. Select No Target

        image

        3. Give it a Proxy Name, and Description, but make the Proxy Base Path is set to /. Apigee’s url matching system is really smart and it will select the best match for each incoming url. This pattern will be the last to match, making it the ‘catch all’.

        image

        4. Everything about this is going to be very barebones. So, make it Pass through (none).

        image
        5. Set it up for all your endpoints.

        image

        6. And then Build it for Dev (or whatever your non-Prod environment is). Don’t worry about the Proxy Name, I needed to remake this picture.

        image

        7. Once it’s Built and Deployed, navigate over to the Develop tab of the new proxy.

        8. In your proxy, you’re going to have only 1 policy and that policy will redirect traffic over to your Developer Portal.
        image

        9. To set this up, use a RaiseFault Policy and set the fault response to look like this:

        image


        10. Make sure you added the new DevPortal-Response policy into your PreFlow Proxy Endpoint as shown in Step 8.

        11. Open up a browser and give it a spin using your Dev endpoint. Of course, test out some of your other API Proxies to make everything still works as you expect. Once everything looks good, promote it on up the environment stack.

        That’s it! It take less than 10 minutes.

        Putting IIS Logs into a Database will Eat Disk Space

        on Monday, September 3, 2018

        The first thing is, Don’t Do This.

        I needed to put our main proxy servers IIS logs into a database in order to calculate out the total bytes sent and total bytes received over time. The reason for the analytics was to estimate the expected cost of running a similar setup in AWS with an Application Load Balancer.

        To load the data, I copied a powershell script from this blog (Not so many…), which was a modification of the original script from the same blog. The script is below. It is meant to be run as scheduled task and to log the details of each run using PowerShellLogging. The script is currently setup to only import a single day of data, but it can be altered to load many days without much effort.

        But I want to focus on the size of the database and the time it takes to load.

        IIS Log Information

        90 Sites
        38 days of logs
        58.8 GB of IIS Logs

        Database Configuration Information

        My Personal Work Machine (not an isolated server)
        MS SQL Server 2016 SP 1
        1TB SSD Drive
        Limited to 5GB Memory
        Core i7-6700
        Windows 10 1803

        First Attempt – An Unstructured Database

        This was “not thinking ahead” in a nutshell. I completely ignored the fact that I needed to query the data afterwards and simply loaded all of into a table which contained no Primary Key or Indexes.

        The good news was it loaded “relatively” quickly.

        Stats

        • 151 Million Records
        • 161 GB of Disk Space (that’s a 273% increase)
        • 7h 30m Running Time

        The data was useless as I couldn’t look up anything without a full table scan. I realized this problem before running my first query, so I have no data on how long that would have taken; but I figure it would have been a long time.

        First Attempt Part 2 – Adding Indexes (Bad Idea)

        Foolishly, I thought I could add the indexes to the table. So, I turned on Simple Logging and tried to add a Primary Key.

        Within 1h 30m the database had grown to over 700 GB and a lot of error messages started popping up. I had to forcefully stop MSSQL Server and delete the .mdf/.ldf files by hand.

        So, that was a really bad idea.

        Second Attempt – Table with Indexes

        This time I created a table with 9 indexes (1 PK, 8 IDX) before loading the data. Script below.

        With the additional indexes and a primary key having a different sort order than the way the data was being loaded, it took significantly longer to load.

        Stats

        • 151 Million Records
        • 362 GB of Disk Space (that’s a 615% increase)
          • 77 GB Data
          • 288 GB Indexes
        • 25h Running Time

        I was really surprised to see the indexes taking up that much space. It was a lot of indexes, but I wanted to be covered for a lot of different querying scenarios.

        Daily Imports

        Stats

        • 3.8 Million Records
        • 6 GB of Disk Space
        • 30m Running Time

        Initial Thoughts …

        Don’t Do This.

        There are a lot of great log organizing companies out there: Splunk, New Relic, DataDog, etc. I have no idea how much they cost, but the amount of space and the amount of time it takes to organize this data for querying absolutely justifies the need for their existence.

        Use PowerShell to Process Dump an IIS w3wp Process

        on Monday, August 27, 2018

        Sometimes processes go wild and you would like to collect information on them before killing or restarting the process. And the collection process is generally:

        • Your custom made logging
        • Open source logging: Elmah, log4Net, etc
        • Built in logging on the platform (like AppInsights)
        • Event Viewer Logs
        • Log aggregators Splunk, New Relic, etc
        • and, almost always last on the list, a Process Dump

        Process dumps are old enough that they are very well documented, but obscure enough that very few people know how or when to use them. I certainly don’t! But, when you’re really confused about why an issue is occurring a process dump may be the only way to really figure out what was going on inside of a system.

        Unfortunately, they are so rarely used that it’s often difficult to re-learn how to get a process dump when an actual problem is occurring. Windows tried to make things easier by adding Create dump file as an option in the Task Manager.

        image

        But, logging onto a server to debug a problem is becoming a less frequent occurrence. With Cloud systems the first debugging technique is to just delete the VM/Container/App Service and create a new instance. And, On-Premise web farms are often interacted with through scripting commands.

        So here’s another one: New-WebProcDump

        This command will take in a ServerName and Url and attempt to take a process dump and put it in a shared location. It does require a number pre-requisites to work:

        • The Powershell command must be in a folder with a subfolder named Resources that contains procdump.exe.
        • Your web servers are using IIS and ASP.NET Full Framework
        • The computer running the command has a D drive
          • The D drive has a Temp folder (D:\Temp)
        • Remote computers (ie. Web Servers) have a C:\IT\Temp folder.
        • You have PowerShell Remoting (ie winrm quickconfig –force) turned on for all the computers in your domain/network.
        • The application pools on the Web Server must have names that match up with the url of the site. For example https://unittest.some.company.com should have an application pool of unittest.some.company.com. A second example would be https://unittest.some.company.com/subsitea/ should have an application pool of unittest.some.company.com_subsitea.
        • Probably a bunch more that I’m forgetting.

        So, here are the scripts that make it work:

        • WebAdmin.New-WebProcDump.ps1

          Takes a procdump of the w3wp process associated with a given url (either locally or remote). Transfers the process dump to a communal shared location for retrieval.
        • WebAdmin.Test-WebAppExists.ps1

          Check if the an application pool exists on a remote server.
        • WebAdmin.Test-IsLocalComputerName.ps1

          Tests if the command will need to run locally or remotely.
        • WebAdmin.ConvertTo-UrlBasedAppPoolName.ps1

          The name kind of covers it. For example https://unittest.some.company.com should have an application pool of unittest.some.company.com. A second example would be https://unittest.some.company.com/subsitea/ should have an application pool of unittest.some.company.com_subsitea.


        Apigee REST Management API with MFA

        on Monday, August 20, 2018

        Not too long ago Apigee updated their documentation to show that Basic Authentication was going to be deprecated on their Management API. This wasn’t really a big deal and it isn’t very difficult to implement an OAuth 2.0 machine-to-machine (grant_type=password) authentication system. Apigee has documentation on how to use their updated version of curl (ie. acurl) to make the calls. But, if you read through a generic explanation of using OAuth it’s pretty straight forward.

        But, what about using MFA One Time Password Token’s (OTP) with OAuth authentication? Apigee supports the usage of Google Authenticator to do OTP tokens when signing in through the portal. And … much to my surprise … they also support the OTP tokens in their Management API OAuth login. They call the parameter, mfa_token.

        This will sound crazy, but we wanted to setup MFA on an account that is used by a bot/script. Since the bot is only run from a secure location, and the username/password are already securely stored outside of the bot there is really no reason to add MFA to the account login process. It already meets all the criteria for being securely managed. But, on the other hand, why not see if it’s possible?

        The only thing left that needed to be figured out was how to generate the One Time Password used by the mfa_token parameter. And, the internet had already done that! (Thank You James Nelson!) All that was left to do was find the Shared Secret Key that the OTP function needed.

        Luckily I work with someone knowledgeable on the subject and they pointed out not only that the OTP algorithm that Google Authenticator uses is available on the internet but that Apigee MFA sign-up screen had the Shared Secret Key available on the page. (Thank You Kevin Wu!)

        When setting up Google Authenticator in Apigeee, click on the Unable to Scan Barcode? link

        image

        Which reveals the OTP Shared Secret:

        image

        From there, you just need a little Powershell to tie it all together:

        System.Configuration.ConfigurationManager in Core

        on Monday, August 13, 2018

        The .NET Core (corefx) issue, System.Configuration Namespace in .Net Core, ends with the question:

        @weshaggard Can you clarify the expectations here for System.Configuration usage?

        I was recently converting a .NET Full Framework library over to a .NET Standard library and ran into the exact problem in that issue, and I also got stuck trying to figure out “When and How are you supposed to use System.Configuration.ConfigurationManager?”

        I ended up with the answer:

        If at all possible, you shouldn’t use it. It’s a facade/shim that only works with the .NET Full Framework. It’s exact purpose is to allow .NET Standard libraries to compile; but it doesn’t work unless the runtime is .NET Full Framework. In order to properly write code using it in a .NET Standard library you will have to use compiler directives to ensure that it doesn’t get executed in a .NET Core runtime. It’s scope, purpose and usage is very limited.

        In a .NET Standard library if you want to use configuration information you need to plan for two different configuration systems.

        • .NET Full Framework Configuration

          Uses ConfigurationManager from the System.Configuration dll installed with the framework. This uses the familiar Configuration.AppSettings[string] and Configuration.ConnectionStrings[string]. This is a unified model in .NET Full Framework and works across all application types: Web, Console, WPF, etc.

        • .NET Core Configuration

          Uses ConfigurationBuilder from Microsoft.Extensions.Configuration. And, really, it expects ConfigurationBuilder to be used in an ASP.NET Core website. And this is the real big issue. The .NET Core team focused almost solely on ASP.NET Core and other target platforms really got pushed to the side. Because of this, it’s expecting configuration to be done through the ASP.NET Configuration system at Startup.

        And, for now, I can only see two reasonable ways to implement this:

        • A single .NET Standard Library that uses compiler directives to determine when to use ConfigurationManager vs a ConfigurationBuilder tie-in.

          This would use the System.Configuration.ConfigurationManager nuget package.

          Pros:
          - Single library with a single nuget package
          - Single namespace

          Cons:
          - You would need a single “Unified Configuration Manager” class which would have #ifdef statements throughout it to determine which configuration system to use.
          - If you did need to reference either the .NET Full Framework or .NET Core Framework the code base would become much more complicated.
          - Unit tests would also need compiler directives to handle differences of running under different Frameworks.
        • A common shared project used in two libraries each targeting the different frameworks.

          This would not use the System.Configuration.ConfigurationManager nuget package.

          This is how the AspNet API Versioning project has handled the situation.

          Pros:
          - The two top-level libraries can target the exact framework they are intended to be used with. They would have access to the full API set of each framework and would not need to use any shims/facades.
          - The usage of #ifdef statements would be uniform across the files as it would only need to be used to select the correct namespace and using statements.
          - The code would read better as all framework specific would be abstracted out of the shared code using extension methods.

          Cons:
          - You would create multiple libraries and multiple nuget packages. This can create headaches and confusion for downstream developers.
          - Unit tests would (most likely) also use multiple libraries, each targeting the correct framework.
          - Requires slightly more overhead to ensure libraries are versioned together and assembly directives are setup in a shared way.
          - The build system would need to handle creating multiple nuget packages.

        Apigee TimeTaken AssignVariable vs JS Policy

        on Monday, August 6, 2018

        Apigee’s API Gateway is built on top of a Java code base. And, all of the policies built into the system are pre-compiled Java policies. So, the built in policies have pretty good performance since they are only reading in some cached configuration information and executing natively in the runtime.

        Unfortunately, these policies come with two big draw backs:

        • In order to do some common tasks (like if x then do y and z) you usually have to use multiple predefined policies chained together. And, those predefined policies are all configured in verbose and cumbersome xml definitions.
        • Also, there’s no way to create predefined policies that cover every possible scenario. So, developers will need a way to do things that the original designers never imagined.

        For those reasons, there are Javascript Policies which can do anything that javascript can do.

        The big drawback with Javascript policies:

        • The system has to instantiate a Javascript engine, populate its environment information, run the javascript file, and return the results back to the runtime. This takes time.

        So, I was curious how much more time does it take to use a Javascript Policy vs an Assign Message Policy for a very simple task.

        It turns out the difference in timing is relatively significant but overall unimportant.

        The test used in the comparison checks if a query string parameter exists, and if it does then write it to a header parameter. If the header parameter existed in the first place, then don’t do any of this.

        Here are the pseudo-statistical results:

        • Average Time Taken (non-scientific measurements, best described as “its about this long”):
          • Javascript Policy: ~330,000 nanoseconds (0.33 milliseconds)
          • Assign Message Policy: ~50,000 nanoseconds (0.05 milliseonds)
        • What you can take away
          • A Javascript Policy is about 650% slower or Javascript has about 280,000 nanoseconds overhead for creation, processing and resolution.
          • Both Policies take less that 0.5 ms. While the slower performance is relatively significant; in the larger scheme of things, they are both fast.

        Javascript Policy

        Javascript Timing Results

        image

        Assign Message Policy

        Assing Message Timing Results

        image

        MyGetUcsb PowerShell Module

        on Monday, July 30, 2018

        MyGet.org makes a great product, as written about many other places (Hanselman, Channel 9). However they don’t have a prebuilt toolset to automate tasks for working with MyGet. It’s a bit ironic that MyGet doesn’t publish their own nuget packages.

        So, MyGetUcsb is a small PowerShell wrapper around their REST Management API. It’s not a complete implementation of their API, and it doesn’t work “right out of the box”.

        • Not a full implementation
          • It only implements the functions that were necessary to setup user accounts in the way our department needed them to be setup.
        • Doesn’t work “right out of the box”
          • The security system is implemented to use a private instance of Secret Server. You’ll need to replace the code that retrieves the API Key with your implementation.
        • Unsupported and No Plans to Work On
          • The implementation was just to solve a problem/need that our department had. There’s no plans to support or improve the project in the future. But, feel free to use it as a reference project to build from.

        Surprisingly, the Enterprise package (with limited SSO integration) still requires all team members to have MyGet Accounts. All team members must maintain their passwords for MyGet. It’s important they store their MyGet username/password information securely as it’s needed to use the feeds.

        To use the module is pretty straight forward. This is an example that will query AD to pull some user information. Convert the information into user objects and then populate MyGet with the account information.

        npm Revoking All Tokens Was A Good Call

        on Monday, July 23, 2018

        A week or so ago an ESLint project maintainer’s npmjs key was compromised. The compromised account was then used to upload alterations into some popular ESLint npm packages. The end goal of the altered code was to capture more credentials from open source package maintainers; presumably to create a truly malicious alteration at a future date.

        A few things were interesting about the whole event. One of the first things that struck me was the quick and uniform responsiveness of the community. Looking through npmjs’ timeline and the initial bug report, it looks like the attacker published the malicious package at 3:40 AM PST on 7/12/2018. And the initial bug report came in around 4:17 AM PDT. That is an amazing turn around time of 27 minutes. It seemingly supports the open source mantra that “many eyes make a shallow problem”.

        The response of the package maintainers and their community members was also fantastic. By 4:59 AM PDT (42 minutes after the report) they had determined that something was seriously wrong and they needed to (a) unpublish the package and (b) had already communicated with downstream sources that they needed to remove all references to the package. This wasn’t done by one person struggling to grapple with the situation, but everyone that was looking at the issue was seeing if they could inform other groups that a serious problem was occurring and action needed to be taken.

        What really struck me was that npm’s administrators determined the correct course of action was to revoke all npmjs tokens created between 7/10/2018 at 5:00 PM PDT and 7/12/2018 at 5:30 AM PDT. npm’s administrators looked at the situation and instead of focusing on just the accounts that they knew to be compromised, they just said we don’t know who to trust right now. They had a reasonable expectation that something very wrong happened in that time frame and they weren’t going to take any chances with it. It was a really big decision, and I’m sure some people were really inconvenienced by it. But it was a well calculated move that took into consideration both security and scope. It was a good call.

        Two things still bug me about the whole incident:

        1. How did the package maintainer’s credentials become compromised?
        2. What if the malicious update didn’t cause a compilation error? How long would it have gone undetected? Can many eyes make a shallow problem if there’s no problem to be seen?

        The weird thing about this incident is that it reminds me of a blog post from January 2018, “I’m harvesting credit card numbers and passwords from your site. Here’s how.”. In the (hopefully fictitious) blog post it outlines how a small piece of malicious code could potentially be added into an open source project and get put into production use. If you take many of the reasonable claims that blog author makes and add to them the idea that a package maintainers publishing key is compromised, it would take the first set of eyes out of the equation. And those eyes are arguably the most important. The blog post posits truly cryptic code to get the pull request accepted. But, what if the attacker didn’t need to make the code overly cryptic, because the attacker had the ability to accept and publish?

        I don’t know.

        The one thing I take away from this is that the community acted very responsibly and swiftly; and that’s something to respect and strive to replicate.

        Apigee–API Key from Query String or HTTP Header

        on Monday, July 16, 2018

        Apigees’ API Proxy samples are a great way to get started, but many usage scenario aren’t available as a sample. A somewhat common scenario is wanting to check for an API Key in multiple places. In this exapmle, the proxy will need to be able to check for a API Key that is present as a query string parameter or an HTTP header. This allows the Gateway to adhere to Postel’s Law by allowing the client to determine what’s the best way to transmit the information to the service.

        That’s all a fancy way of saying: Let’s make it easy check if the API Key is passed in as a Header or a Query String.

        Unfortunately, with Apigee, it’s not so easy to check both of them. In this example, we’ll use a Javascript Policy to check if the API Key exists in the query string. If it does, the value will be copied into a header variable. After that, a normal Verify API Key Policy will be used to check the header value.

        Hopefully, in a future post, I can reimplement this using only Apigee Policies and without using Javascript. There is a performance penalty that comes with using Javascript in Apigee and I would like to see just how severe that penalty can be.

        Here is a Shared Flow that will do just the two steps mentioned above:

        And, now for the Javascript. Which is a combination of a Policy and a .js file. This one does all the heavy lifting:

        Finally, use the standard Verify API Key policy to check the header value:


        Creative Commons License
        This site uses Alex Gorbatchev's SyntaxHighlighter, and hosted by herdingcode.com's Jon Galloway.